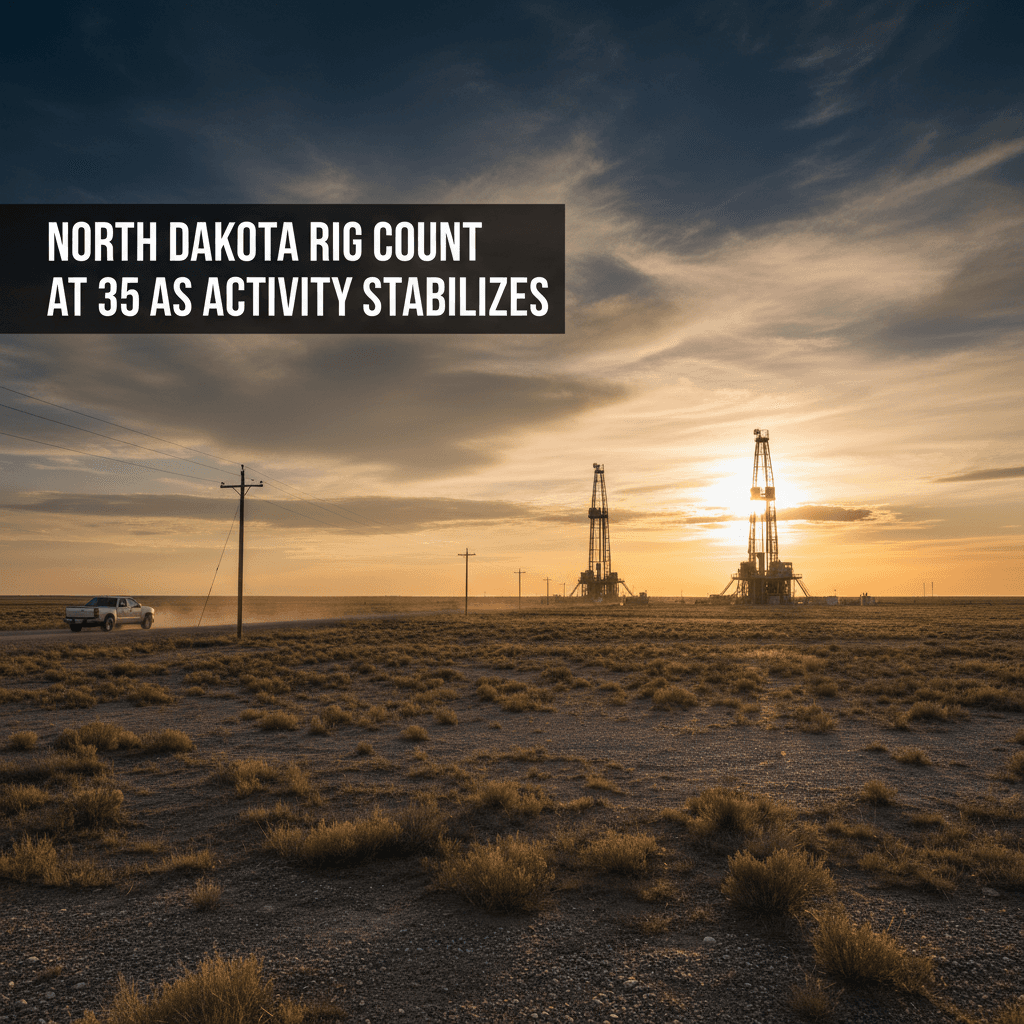
North Dakota Rig Count Holds at 35 as Activity Stabilizes
The state's active rig fleet shows no daily movement but remains eight rigs higher than one month ago, reflecting a recent uptick in drilling activity.
The number of rigs actively drilling for oil and gas in North Dakota remained unchanged on Monday, September 7, holding steady at 35, according to live rig data from Bakken Wire.
No rigs were added, removed, or moved locations in the 24-hour reporting period, indicating a day of operational stability across the Williston Basin.
The current count represents a slight decline from the activity level seen one week prior. On August 31, 2026, the state reported 36 active rigs, meaning the fleet has decreased by one rig over the past seven days.
Despite the recent weekly dip, the broader trend shows a significant increase in drilling activity compared to late summer. One month ago, on August 8, 2026, the active rig count stood at 27. The current level of 35 rigs marks an increase of eight rigs, or nearly 30 percent, over that four-week period.
The rig count is a closely watched leading indicator for future oil production in the Bakken formation, North Dakota's primary oil-producing region. An increase in active rigs typically signals that operators are investing in new well development, which will lead to new production coming online in the following months.
The stability at 35 rigs suggests operators are maintaining a consistent pace of development after a notable ramp-up in early August. This level of activity is often influenced by prevailing crude oil prices, operator capital expenditure budgets, and the availability of drilling crews and equipment.
For royalty owners and service companies in the basin, the sustained higher count compared to a month ago is a positive signal for near-term activity. However, the lack of day-over-day growth and the slight weekly decrease will be monitored to see if it marks a pause or a plateau in the recent upward trend.
Industry analysts typically view the rig count in conjunction with well completion data and production reports to gauge the overall health of the Bakken shale play. The current count reflects a period of measured growth following a lower activity period in early August.
Source
Bakken Wire live rig data and historical context.